Dry Cleaning Profit Margin Calculator (Free + Instant Results)
Running a dry cleaning business can be highly profitable, but only if you understand your true profit margins. This Dry Cleaning Profit Margin Calculator helps you instantly calculate revenue, expenses, average ticket size, and profitability in real-time.
Whether you run a small neighborhood cleaner or manage multiple commercial contracts, this tool provides accurate financial insights, industry benchmarks, and actionable recommendations to help you increase profit and reduce costs.
Dry Cleaning Profit Margin Calculator
Business Revenue
Operating Expenses
Instant Results
Total Revenue: $0
Total Expenses: $0
Average Ticket Size: $0
Orders Per Day: 0
Net Profit: $0
Profit Margin: 0%
Step-by-Step Calculations
Table of Contents
How to Calculate Dry Cleaning Profit Margin
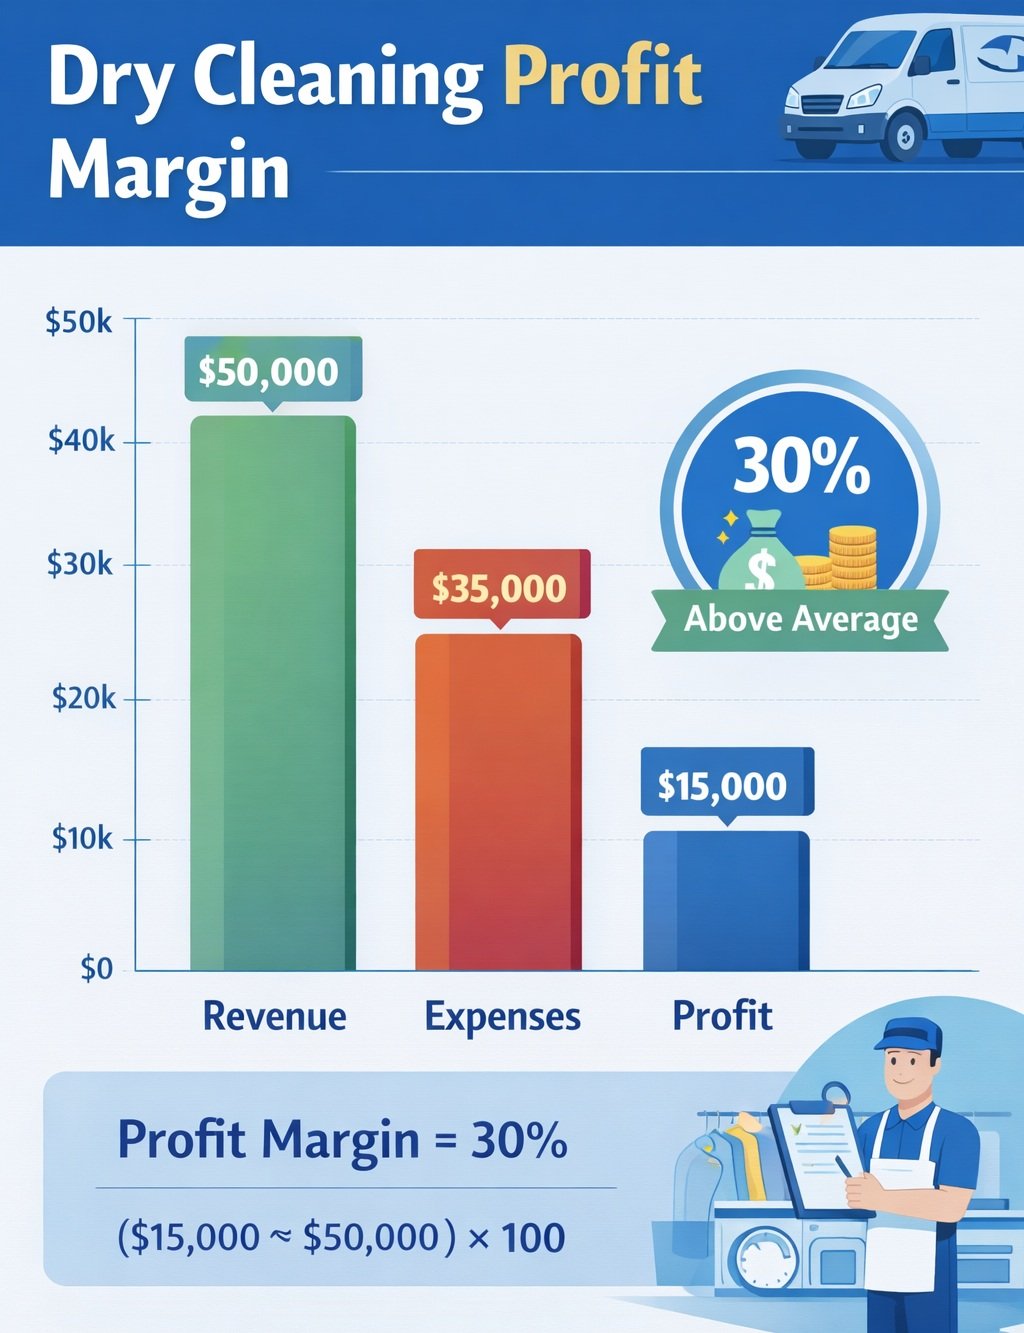
Profit Margin = (Net Profit ÷ Total Revenue) × 100
Net Profit = Total Revenue – Total Expenses
This formula helps dry cleaning businesses understand how much profit they make from their total revenue after covering all expenses.
Example Calculation
If your laundry business generates $50,000 in revenue and has $35,000 in expenses:
- Net Profit = $50,000 – $35,000 = $15,000
- Profit Margin = ($15,000 ÷ $50,000) × 100 = 30%
A 30% profit margin indicates a highly profitable dry cleaning business compared to industry averages.
How to Use our Dry Cleaning Profit Margin Calculator
Follow these simple steps to calculate your dry cleaning business profit, expenses, and profit margin in real time. This calculator works for both small laundromats and large commercial dry cleaning operations.
Step 1: Select Time Period (Monthly or Yearly)
Choose whether you want to calculate your profit on a monthly or yearly basis. This helps you analyze short-term performance or long-term business growth.
Step 2: Enter Business Revenue
Add your total income from different revenue streams if any:
- Residential customers
- Restaurants and commercial accounts
- Hospitals or clinic contracts
- Other contracts or specialty services
The calculator will automatically combine these values to determine your total revenue.
Step 3: Input Total Number of Orders
Enter the total number of orders processed during the selected time period. This helps calculate:
- Average ticket size
- Orders per day
Step 4: Add All Business Expenses
Enter all your operational costs to get an accurate profit calculation:
- Rent or lease payments
- Utilities (electricity, water, gas)
- Labor costs (wages, payroll, benefits)
- Supplies (detergents, solvents, packaging)
- Equipment costs and maintenance
- Transportation and delivery expenses
- Administrative and business fees
- Taxes and other overhead costs
Step 5: View Instant Results
As you enter your data, the calculator automatically updates and shows:
- Total Revenue
- Total Expenses
- Net Profit
- Profit Margin (%)
- Average Ticket Size
- Orders Per Day
Step 6: Analyze Your Profit Margin
Your profit margin will be categorized as:
- Above Average (25% or higher)
- Average (15% – 24.99%)
- Below Average (below 15%)
Use this insight to understand your business performance compared to industry benchmarks.
Step 7: Review Step-by-Step Calculations
The calculator also shows a detailed breakdown of how your results are calculated. This helps you:
- Understand where your money is going
- Identify high expenses
- Make better pricing and cost decisions
Pro Tip to Increase Profit
If your profit margin is low, consider increasing your average ticket size, reducing labor costs, or adding high-margin services like wedding gown cleaning or pickup & delivery.
What Is a Good Profit Margin for Laundry Business?
| Profit Margin | Performance Level |
| Below 15% | Below Average |
| 15% – 25% | Average |
| 25%+ | Above Average |
Real-Life Example: Dry Cleaning Business Profit Margin (Monthly & Yearly)
Let’s understand how a real dry cleaning business works using a simple example. Imagine you own a medium-sized laundry shop with both residential and commercial customers.
Monthly Business Overview
Your business serves local customers, restaurants, and offers pickup & delivery services. Here is your monthly performance:
- Total Orders: 2,400 orders per month
- Orders Per Day: 80 orders/day
- Average Ticket Size: $20 per order
- Total Revenue: $48,000
Monthly Revenue Breakdown
- Residential Customers: $25,000
- Restaurants & Commercial: $12,000
- Pickup & Delivery: $6,000
- Specialty Services (wedding gowns, alterations): $5,000
Total Operating Expenses (Monthly)
- Rent / Lease: $4,000
- Property Taxes: $800
- Insurance: $700
- Licenses & Permits: $300
- POS System / Software: $200
- Utilities (Electricity, Water, Gas): $6,000
- Labor Cost (Wages, Payroll, Benefits): $14,000
- Supplies (Detergents, Solvents, Packaging): $3,000
- Equipment Costs (Maintenance & Repairs): $2,000
- Transportation Cost (Fuel & Delivery): $1,500
- Transaction Fees (Credit Cards): $1,200
- Administrative Costs: $1,000
- Other Costs: $1,500
Total Expenses: $36,200
---Profit Calculation (Monthly)
- Total Revenue: $48,000
- Total Expenses: $36,200
- Net Profit: $11,800
- Profit Margin: 24.6%
👉 This is a good profit margin, but let’s see how improving pricing and efficiency can increase profits.
---Optimized Business Scenario (Higher Profit)
By slightly increasing prices, improving efficiency, and reducing waste, your business improves:
- New Revenue: $52,000
- New Expenses: $35,000
- Net Profit: $17,000
- Profit Margin: 32.7%
👉 This shows how small improvements can push your profit margin into the 30–40% range.
---Yearly Business Summary
- Total Yearly Revenue: $624,000
- Total Yearly Expenses: $420,000
- Net Yearly Profit: $204,000
- Yearly Profit Margin: 32.7%
Key Insights from This Example
- Higher ticket size increases revenue without more customers
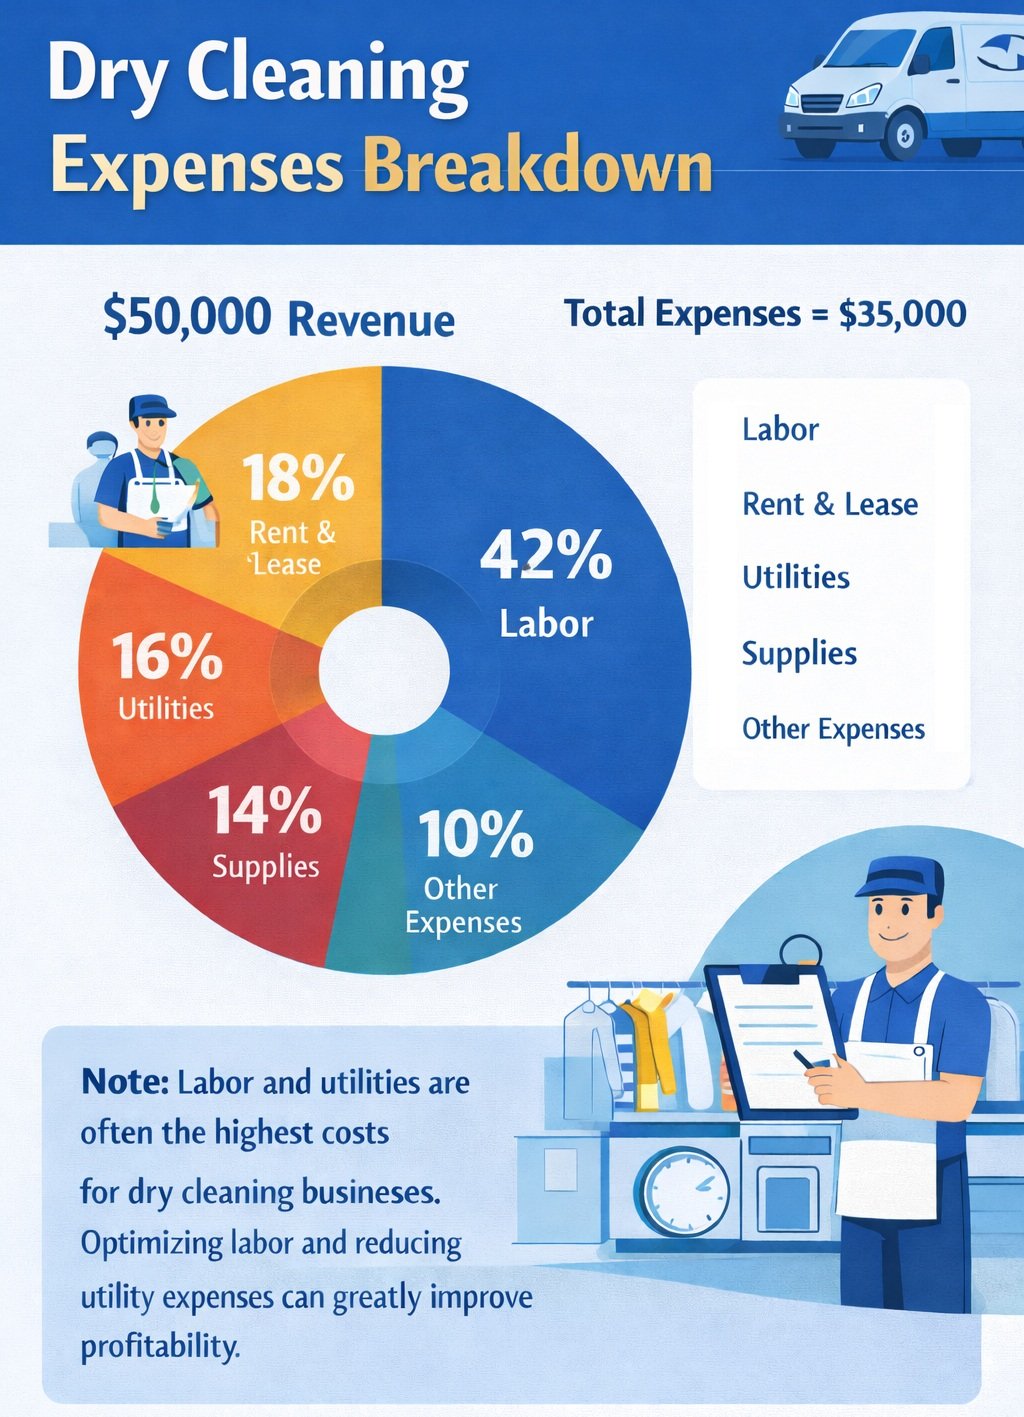
- Labor and utilities are the biggest expenses
- Small cost reductions can significantly increase profit
- Commercial contracts provide stable income
This example shows how a well-managed dry cleaning business can achieve a strong profit margin and steady growth.
Dry Cleaning Profit Margin by Service Type
High-margin dry cleaning services include wedding dress cleaning, alterations, and specialty garments. These services can have profit margins of 60% to 80%, while basic items like shirts usually have lower margins of 40% to 60%.
Which Dry Cleaning Services Make the Most Profit?
Not all dry cleaning services make the same profit. Some items bring in much higher margins than others. For example, basic shirt cleaning has a lower profit margin because prices are competitive and costs are steady. On the other hand, services like wedding dress cleaning and alterations can bring much higher profits.
If you are running a laundry business, focusing on high-margin services is very important. Many business owners increase profits by offering premium services or specialty cleaning. This is one of the easiest ways to improve dry cleaning profit margin per item and grow your business faster.
Services Breakdown by Item Type
| Service Type | Average Price | Cost per Item | Profit Margin |
|---|---|---|---|
| Shirt Cleaning | $2.50 – $4.00 | $1.50 | 40% – 60% |
| Suit Dry Cleaning | $10 – $20 | $5 – $8 | 50% – 70% |
| Wedding Dress | $150 – $300 | $60 – $100 | 60% – 75% |
| Alterations | $15 – $50 | $5 – $15 | 60% – 80% |
Dry Cleaning Profit Margin by Business Size
The average dry cleaning profit margin ranges from 10% to 50%. Small shops typically earn 10%–20%, mid-size stores earn 20%–35%, and larger businesses can reach 30%–50% due to better efficiency and higher volume.
How Much Profit Does a Dry Cleaning Business Make?
The profit margin of a dry cleaning business depends a lot on its size. Small shops usually have lower margins because they have fewer customers and higher costs per order. Mid-size stores often perform better because they have steady demand and better efficiency.
Larger or multi-location businesses usually have the highest margins. They can reduce costs by buying supplies in bulk and managing operations better. On average, a dry cleaning business profit margin can range from 10% to 50%, depending on location, pricing, and services offered.
Average Dry Cleaning Profit Margins
| Business Type | Revenue | Profit Margin |
|---|---|---|
| Small Shop | $10K – $25K/month | 10% – 20% |
| Mid-Size Store | $25K – $60K/month | 20% – 35% |
| Multi-Location Business | $100K+/month | 30% – 50% |
Ways to Increase Dry Cleaning Profit Margins
You can increase dry cleaning profit margins by offering premium services, bundling items, adding pickup and delivery, reducing waste, and focusing on high-margin services like alterations and specialty cleaning.
Simple Ways to Boost Your Dry Cleaning Business Profit
Improving profit margins does not always mean raising prices. Small changes in your business can make a big difference. For example, offering bundle deals or premium services can increase your average ticket size.
Adding pickup and delivery services is another great way to earn more. Customers are willing to pay extra for convenience. You can also reduce costs by improving staff scheduling and cutting down on wasted materials.
Focusing on high-margin services like alterations or specialty cleaning is one of the best ways to increase your dry cleaning business profit quickly.
Best Strategies to Increase Profit Margins
| Strategy | Impact on Profit |
|---|---|
| Bundle Services | Increase ticket size by 15%–30% |
| Pickup & Delivery | Add premium pricing |
| Reduce Solvent Waste | Lower operating cost |
| Focus on High-Margin Items | Boost profit significantly |
Cost to Dry Clean Clothes: Per Garment Breakdown
The cost to dry clean clothes per garment usually ranges from $2 to $5. This includes labor, cleaning chemicals, utilities, and packaging. Labor is often the largest expense in the dry cleaning process.
What Are the Main Costs in Dry Cleaning?
Every garment you clean has a cost behind it. These costs include labor, cleaning chemicals, utilities, and packaging. Labor is often the biggest cost because each item needs to be handled carefully.
Utilities like electricity and water also add up, especially when machines run all day. Chemicals and solvents are another important cost in the process. Understanding this breakdown helps you control expenses and improve your cost to dry clean clothes.
By managing these costs well, you can increase your profit without raising prices too much.
Cost Breakdown Per Garment
| Cost Component | Estimated Cost |
|---|---|
| Labor | $0.80 – $2.00 |
| Solvent & Chemicals | $0.50 – $1.50 |
| Utilities | $0.30 – $1.00 |
| Packaging | $0.20 – $0.50 |
How to Increase Profit Margin in a Dry Cleaning Business
Improving your profit margin does not always mean working harder. It means working smarter.
Small changes in pricing, costs, and services can make a big difference in your profits.
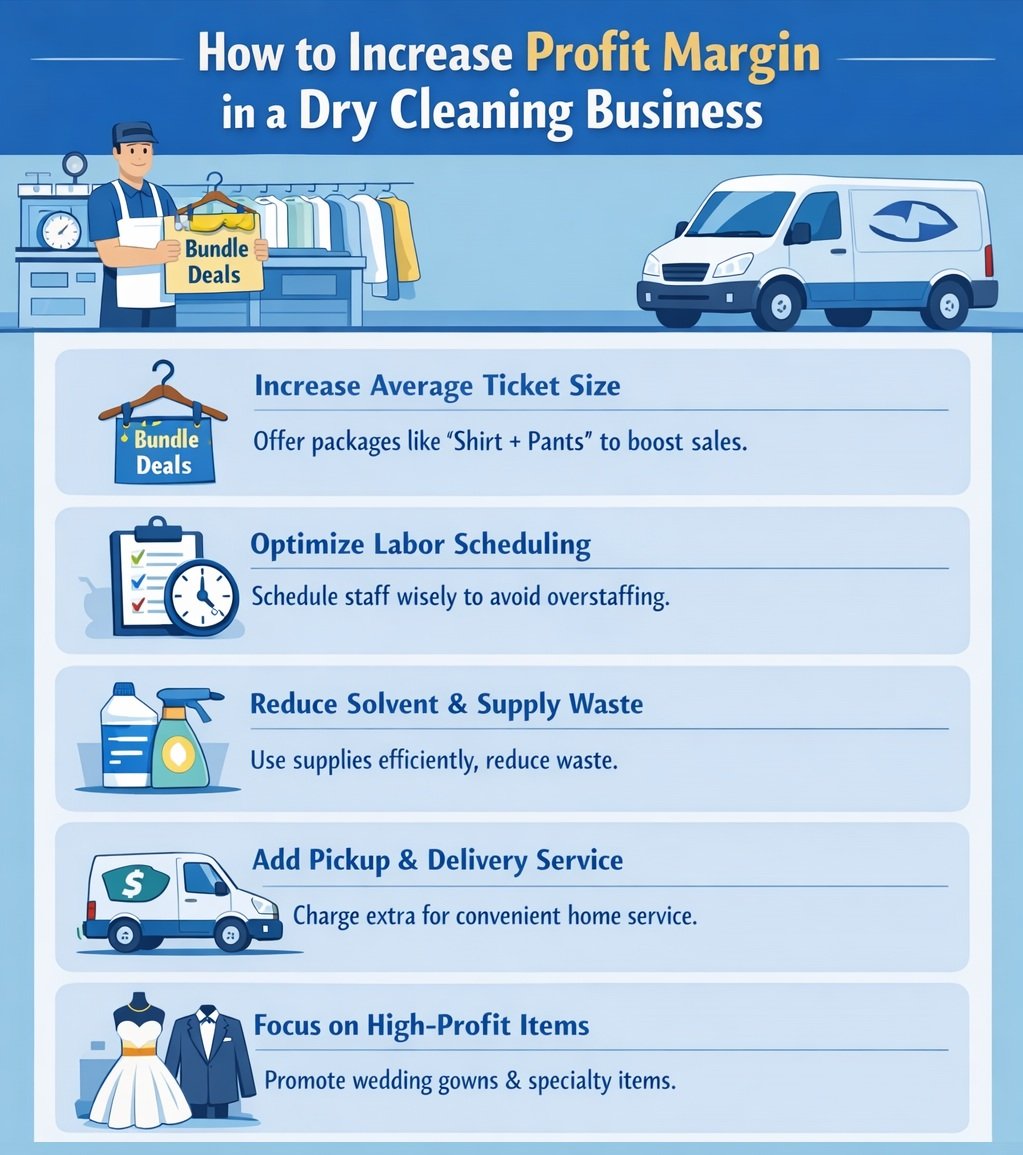
1. Increase Your Average Ticket Size
Best way to increase your ticket size is to earn more from each customer visit. You can do this by offering bundle deals like
“Shirt + Pants cleaning” or discounts when customers bring more items. This increases your total revenue without needing more customers.
2. Optimize Labor Scheduling
Labor is one of the biggest costs in dry cleaning. Make sure you have the right number of employees
at the right time. Avoid overstaffing during slow hours and schedule more workers during busy times.
3. Reduce Solvent and Supply Waste
Solvents, detergents, and packaging materials can be expensive. Train your staff to use the correct amounts
and avoid waste. Regular machine maintenance can also help reduce extra usage.
4. Offer Pickup and Delivery Services
Many customers are willing to pay extra for convenience. Adding pickup and delivery services with a small fee
can increase your revenue and attract more customers.
5. Focus on High-Profit Services
Some services bring in more profit than others. Items like wedding gowns, alterations, leather cleaning,
and specialty garments usually have higher margins. Promote these services to boost your overall profit.
Quick Tip
Even a small increase in price or a small reduction in cost can improve your profit margin over time.
Track your numbers regularly and make smart adjustments.
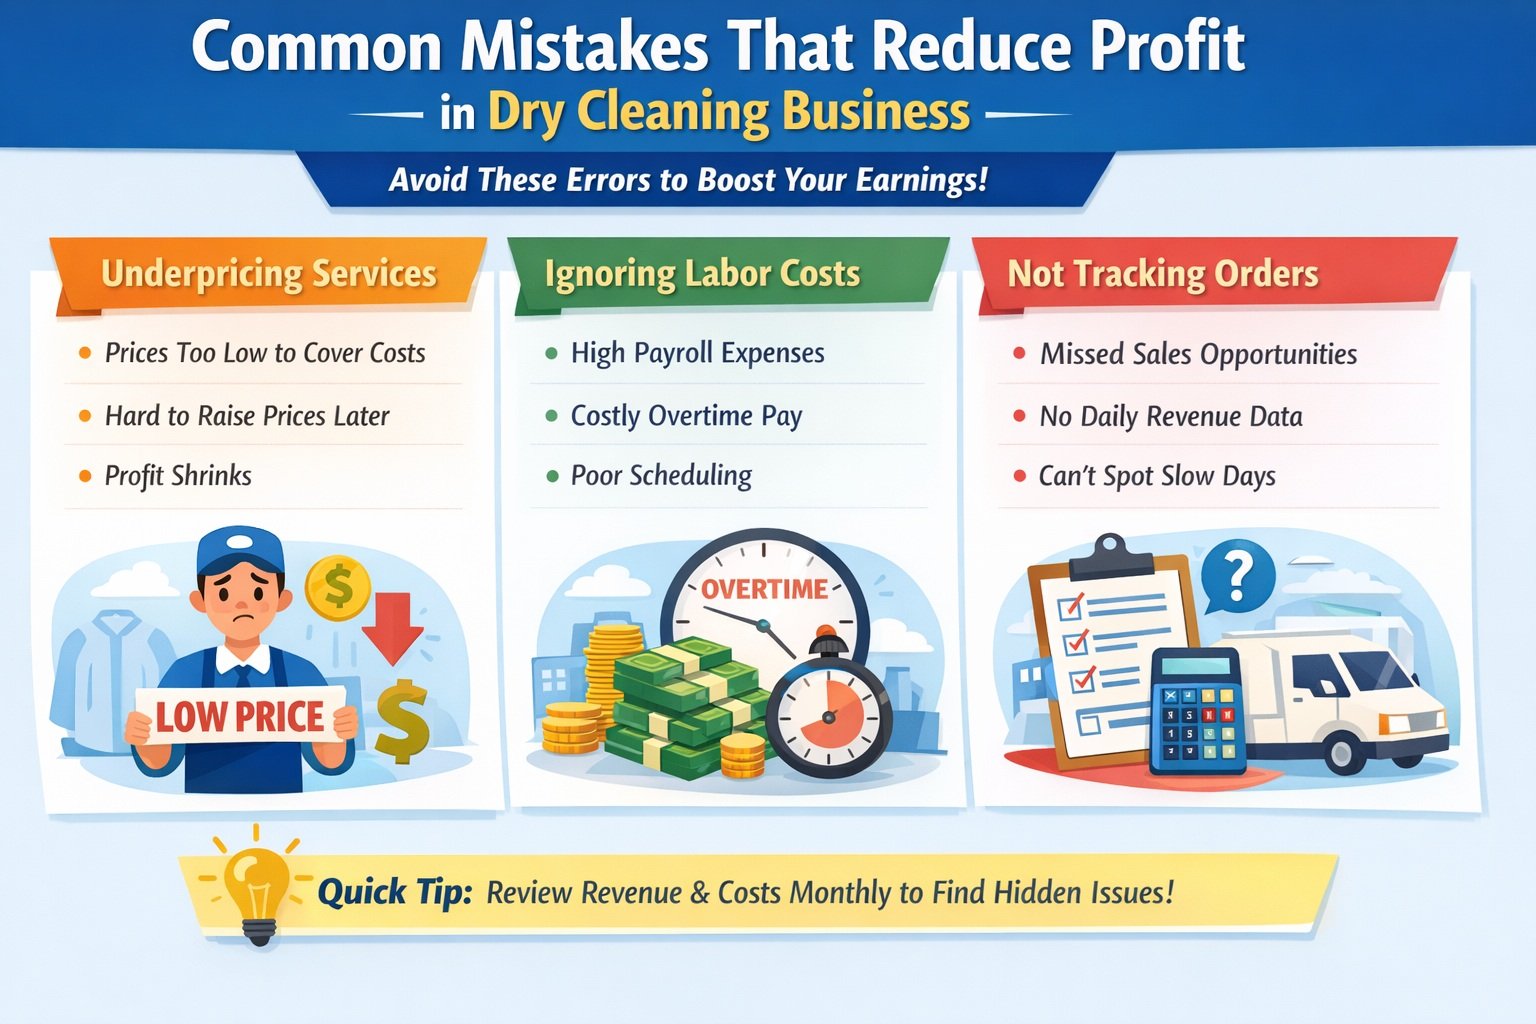
Common Mistakes That Reduce Profit in Dry Cleaning Business
Many dry cleaning businesses lose money not because of low customers, but because of small mistakes in pricing, cost control, and daily tracking. Avoiding these mistakes can quickly improve your profit margin.
Underpricing Services in Dry Cleaning Business
One of the biggest mistakes is charging too little for your services. Many business owners try to attract customers with low prices, but this can reduce profits.
- Low prices may not cover your real costs
- You may struggle to pay rent, labor, and utilities
- It becomes hard to increase prices later
Instead, focus on offering value. You can bundle services or add premium options to increase your average ticket size without losing customers.
Ignoring Labor Cost in Laundry and Dry Cleaning Business
Labor is usually the biggest expense in a dry cleaning business. Many owners do not track it properly.
- Too many staff during slow hours increases costs
- Overtime pay reduces profit
- Poor scheduling leads to waste of money
Try to schedule employees based on busy hours. Track how many orders each employee handles. This will help you control labor costs and improve efficiency.
Not Tracking Daily Orders and Revenue Properly
If you are not tracking your daily orders, you are missing important data about your business.
- You won’t know your peak days
- You cannot calculate average ticket size
- You cannot identify slow periods
Tracking orders helps you understand your business better. It also helps you plan staffing, pricing, and promotions.
Quick Tip to Avoid These Mistakes
Review your revenue and expenses every month. Even small changes like increasing price by $1 or reducing one extra staff hour per day can improve your profit over time.
Laundry vs Dry Cleaning Business – Key Differences
| Factor | Laundry Business | Dry Cleaning Business |
|---|---|---|
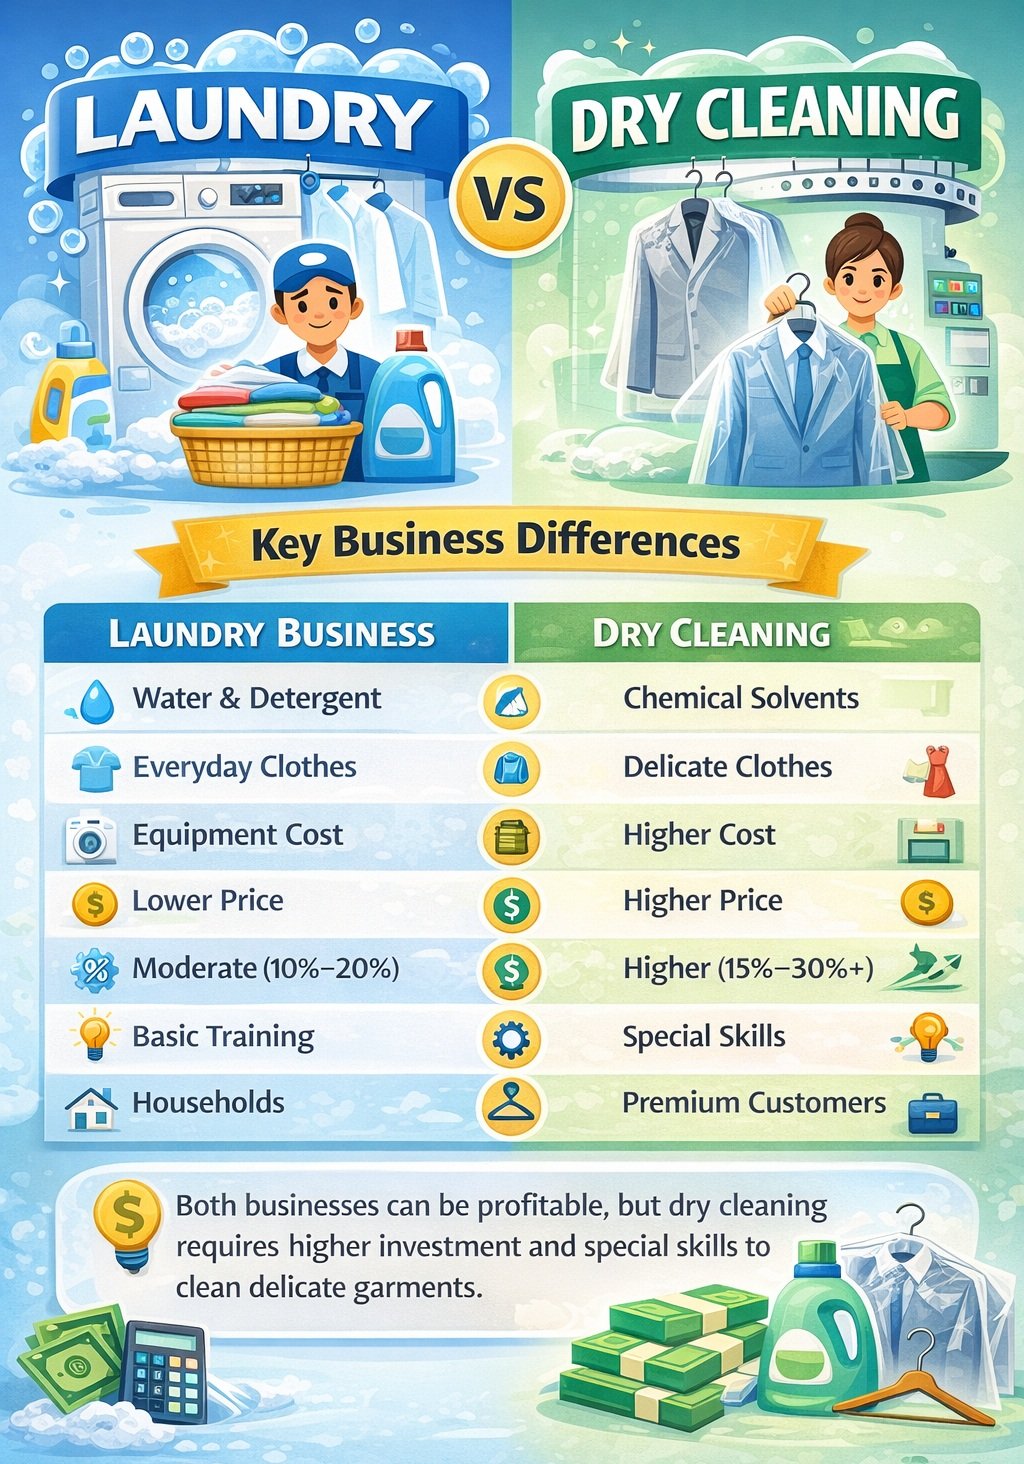
| Cleaning Method | Uses water and detergent | Uses chemical solvents |
| Type of Clothes | Everyday clothes (shirts, jeans) | Delicate clothes (suits, silk, dresses) |
| Equipment Cost | Lower cost machines | Higher cost machines |
| Service Price | Lower price per item | Higher price per item |
| Profit Margin | Moderate (10%–20%) | Higher (15%–30%+) |
| Skill Required | Basic training | Special skills needed |
| Target Customers | Daily household customers | Professional & premium customers |
Simple Explanation
Laundry and dry cleaning businesses are similar, but they work in different ways. Laundry uses water and is mainly for everyday clothes. Dry cleaning uses special chemicals and is used for delicate or expensive garments. Dry cleaning usually charges more and can have higher profit margins, but it also needs more skill and higher investment. Both businesses can be profitable if managed properly.
Dry Cleaning Profit Margin – Frequently Asked Questions
What is a good profit margin for dry cleaning business?
A good profit margin for a dry cleaning business typically ranges between 15% and 25%. Margins above 25% are considered excellent, while anything below 15% may indicate high costs or low pricing.
How do you calculate profit margin in laundry business?
Profit margin is calculated using the formula: (Net Profit ÷ Total Revenue) × 100. Net profit is your total revenue minus all expenses.
What are the biggest expenses in dry cleaning?
The biggest expenses usually include labor, utilities (electricity, water, gas), rent, and cleaning supplies. Labor alone can account for 30% to 45% of total costs.
Is dry cleaning business profitable in 2025?
Yes, dry cleaning can still be profitable in 2025 if managed efficiently. Businesses that control costs, offer delivery services, and focus on high-margin items tend to perform well.
How much revenue does a dry cleaner make?
Revenue varies by size. Small shops may earn $10,000–$40,000 per month, while larger operations can exceed $100,000 per month.
How to increase profit in dry cleaning business?
You can increase profit by raising average ticket size, reducing labor costs, minimizing waste, and offering premium services like wedding gown cleaning or delivery.
What is average ticket size in dry cleaning?
The average ticket size typically ranges between $8 and $25 per order, depending on services offered and location.
What is break-even point in laundry business?
The break-even point is when your total revenue equals total expenses. At this point, your business is not making a profit or loss.
Monthly vs yearly profit calculation difference?
Monthly calculations help track short-term performance, while yearly calculations provide a broader view of business growth and seasonal trends.
How many orders per day is good for profit?
Most dry cleaners need at least 20–50 orders per day to stay profitable, while high-performing stores may handle 100+ orders daily.
Related Calculators
Important Laundry or Dry Cleaning Business Tracking Forms – Downloadable
Dry Cleaning Cost Reduction Checklist
Business Name: ____________________________________
Location: __________________________________________
Month / Year: _______________________________________
Owner / Manager: ____________________________________
Stores #:___________
1. Daily Operations Efficiency
☐ Turn off idle machines when not in use
☐ Run machines only with full loads
☐ Avoid re-cleaning garments (quality control check)
☐ Monitor water and energy usage daily
☐ Track daily orders vs labor hours
2. Utility Cost Reduction (Electricity, Water, Gas)
☐ Install energy-efficient machines (Energy Star if possible)
☐ Use LED lighting throughout the store
☐ Fix water leaks immediately
☐ Optimize boiler and steam usage
☐ Schedule heavy operations during off-peak hours
☐ Insulate pipes to reduce heat loss
👉 Goal: Reduce utilities by 10–20%
3. Labor Cost Optimization
☐ Schedule staff based on peak hours
☐ Avoid overstaffing during slow periods
☐ Cross-train employees (multi-task roles)
☐ Track productivity (orders per employee)
☐ Reduce overtime costs
☐ Use part-time staff during busy seasons
👉 Goal: Keep labor under 35–45% of revenue
4. Supplies & Chemical Cost Control
☐ Use correct amount of solvents and detergents
☐ Train staff to avoid chemical overuse
☐ Buy supplies in bulk for discounts
☐ Compare suppliers regularly
☐ Monitor inventory to avoid waste/expiry
☐ Use eco-friendly and reusable materials where possible
5. Equipment Maintenance & Efficiency
☐ Perform regular machine maintenance
☐ Clean filters and traps frequently
☐ Replace worn-out parts before breakdown
☐ Track repair costs vs replacement cost
☐ Upgrade old inefficient machines
👉 Preventive maintenance = lower long-term cost
6. Transportation & Delivery Cost Savings
☐ Optimize delivery routes (use route planning tools)
☐ Combine deliveries to reduce trips
☐ Maintain vehicles regularly for fuel efficiency
☐ Track fuel usage weekly
☐ Charge delivery fees where applicable
7. Reduce Financial & Transaction Fees
☐ Negotiate lower credit card processing fees
☐ Encourage cash or ACH payments
☐ Review bank charges regularly
☐ Avoid unnecessary subscriptions or software
8. Smart Marketing Spend
☐ Track ROI of every marketing channel
☐ Focus on high-performing ads only
☐ Use local SEO instead of expensive ads
☐ Encourage referrals (low-cost marketing)
☐ Use email/SMS marketing instead of paid ads
9. Rent & Fixed Cost Management
☐ Negotiate lease terms (if possible)
☐ Sublease unused space
☐ Compare insurance providers annually
☐ Review licenses and avoid unnecessary renewals
10. Monitor Key Cost Metrics (VERY IMPORTANT)
☐ Labor % of revenue
☐ Utilities % of revenue
☐ Cost per order
☐ Profit margin %
👉 Track monthly and compare trends
11. Reduce Waste & Losses
☐ Prevent garment damage (reduce refunds)
☐ Improve stain removal accuracy
☐ Track lost/damaged items
☐ Reduce packaging waste
12. Inventory Management
☐ Maintain optimal stock levels
☐ Avoid over-ordering
☐ Use FIFO (First In, First Out)
☐ Track shrinkage and losses
13. Increase Efficiency Instead of Just Cutting Costs
☐ Increase average ticket size (bundling)
☐ Focus on high-margin services
☐ Improve workflow speed
☐ Reduce turnaround time
👉 More efficiency = higher profit without cutting quality
BONUS: Monthly Cost Audit Checklist
Use this once per month:
☐ Did expenses increase this month? Why?
☐ Which category is highest cost?
☐ Can any cost be reduced next month?
☐ Are we within target profit margin (15–25%)?
Dry Cleaning Business Benchmark Report
This report helps you compare your dry cleaning business performance with industry benchmarks. Use this to identify strengths, weaknesses, and opportunities to improve your profit margin.
1. Business Overview
| Business Name | |
| Location | |
| Business Type | |
| Number of Locations | |
| Years in Business |
2. Revenue Benchmarks
| Metric | Your Value | Industry Benchmark |
|---|---|---|
| Monthly Revenue | $10K – $100K+ | |
| Yearly Revenue | $120K – $1M+ | |
| Revenue Growth (%) | 5% – 15% |
3. Orders & Sales Benchmarks
| Metric | Your Value | Benchmark |
|---|---|---|
| Orders per Day | 20 – 100+ | |
| Average Ticket Size | $8 – $25 | |
| Total Orders per Month |
4. Profitability Benchmarks
| Metric | Your Value | Benchmark |
|---|---|---|
| Net Profit | ||
| Profit Margin (%) | 15% – 25% |
5. Expense Breakdown Benchmarks
| Category | Your % | Benchmark |
|---|---|---|
| Labor | 30% – 45% | |
| Utilities | 10% – 20% | |
| Rent | 5% – 10% | |
| Supplies | 5% – 10% | |
| Transportation | 3% – 8% | |
| Fees & Admin | 2% – 5% |
6. Cost Efficiency Metrics
| Revenue per Order | |
| Cost per Order | |
| Profit per Order |
7. Break-even Analysis
| Break-even Revenue | |
| Break-even Orders per Day |
8. Seasonal Performance
| Best Month | |
| Lowest Month | |
| Seasonal Trends |
9. Growth Indicators
| Revenue Growth % | |
| Repeat Customers % | |
| New Customers |
10. Business Health Score
| Profit Margin Score | /10 | |
| Cost Efficiency Score | /10 | |
| Growth Score | /10 | |
| Labor Efficiency | /10 | |
| Total Score | /100 |
Score Interpretation:
0–40: Needs Improvement
40–70: Stable
70+: High Performing
11. Benchmark Comparison Summary
Compare your performance against industry standards to identify improvement areas.
12. Actionable Insights
- Reduce labor costs if above benchmark
- Increase pricing if average ticket is low
- Focus on high-margin services
- Optimize operational efficiency
13. Key Takeaways
| Biggest Expense | |
| Biggest Opportunity | |
| Strengths |
14. Recommended Action Plan
| Short-term (1–3 months) | |
| Mid-term (3–6 months) | |
| Long-term (6–12 months) |
References
The information and benchmarks used in this calculator are based on industry reports and trusted sources: